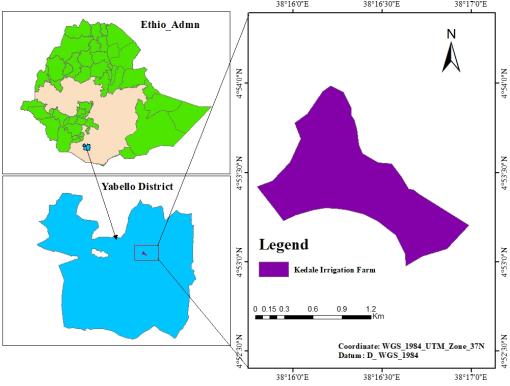
Soil salinity is a significant challenge to crop productivity, particularly in arid and semi-arid regions. Effective mitigation requires a thorough understanding of soil chemical composition and water quality before implementing sustainable irrigation projects. This study aimed to characterize, classify, and map soil salinity and sodicity in the small-scale Kedale irrigation area of Yabello district. A total of 42 composite soil samples were collected from irrigated farm plots at four depths (0-30 cm, 30-60 cm, 60-90 cm, and 90-120 cm) and analyzed for soil texture, pH, electrical conductivity (EC), cation exchange capacity (CEC), exchangeable bases (Ca, Mg, Na, K), exchangeable sodium percentage (ESP), and sodium adsorption ratio (SAR). Soil salinity and sodicity were mapped using ArcGIS 10.8 with Kriging interpolation. Additionally, irrigation water samples were analyzed for ECe, pH, ESP, and SAR to assess water quality. The results showed that soil texture varied from sandy loam at shallow depths to sandy clay at deeper layers. The soil's average ESP, EC, and pH were 16.41%, 3.99 mmhos/cm, and 8.62, respectively, indicating that it is sodic according to FAO classification. Irrigation water analysis further revealed a slightly sodic nature. To ensure sustainable agricultural productivity in the Kedale irrigation scheme, immediate soil salinity management is recommended. Key interventions include gypsum application, organic amendments such as compost, the cultivation of salt-tolerant crops, the adoption of environmentally friendly irrigation practices, and farmer education on effective land and water management strategies.
| Published in | International Journal of Natural Resource Ecology and Management (Volume 10, Issue 2) |
| DOI | 10.11648/j.ijnrem.20251002.12 |
| Page(s) | 68-79 |
| Creative Commons |
This is an Open Access article, distributed under the terms of the Creative Commons Attribution 4.0 International License (http://creativecommons.org/licenses/by/4.0/), which permits unrestricted use, distribution and reproduction in any medium or format, provided the original work is properly cited. |
| Copyright |
Copyright © The Author(s), 2025. Published by Science Publishing Group |
Composite, Saline Soil, Sodic Soil, Productivity, Soil Profile
Classification | EC of saturation extracts (ECe) at 25°C (mmhos/cm) | Exchangeable Na percentage (ESP) | pH (H2O) | Soil physical condition |
|---|---|---|---|---|
Saline | >4 | <15 | <8.5 | Normal |
Sodic (alkali) | <4 | >15 | >8.5 | Very poor |
Saline sodic | >4 | >15 | >8.5 | Normal |
Non-saline non-sodic | <4 | <15 | ≈7.0 | Normal |
Salinity (ECe in dS/m) | Sodicity (ESP in%) | ||
|---|---|---|---|
Intensity | FAO (2008) | Intensity | FAO (2008) |
Non saline | 0.75 | Non-sodic | 6 |
Slightly saline | 0.75-2 | Slightly sodic | 6-10 |
Moderately saline | 2-4 | Moderately sodic | 10-15 |
Strongly saline | 4-8 | Strongly sodic | 15-25 |
Very Strongly saline | 8-15 | Extremely sodic | >25 |
No. | Salinity class | EC (mmhos/cm) | Sodicity class | SAR value |
|---|---|---|---|---|
1 | Low saline | 0.1- 0.25 | Low Sodicity | <10 |
2 | Medium saline | 0.25-0.75 | Medium Sodicity | 10 to 18 |
3 | High saline | 0.75 - 2.25 | High Sodicity | 18 to 26 |
4 | Very high saline | >2.25 | Very high Sodicity | >26 |
No | Depth | %sand | %clay | %silt | Soil Textural class |
|---|---|---|---|---|---|
1 | 0-30 | 61.45 | 18.77b | 19.78a | Sandy Loam |
2 | 30-60 | 57.92 | 32.65a | 9.43b | Sandy clay Loam |
3 | 60-90 | 52.26 | 39.34a | 8.39b | Sandy clay |
4 | 90-120 | 56.65 | 31.63a | 11.72b | Sandy clay loam |
CV | 11.73 | 21.17 | 43.25 | ||
LSD | ns | 8.93 | 7.35 | ||
P- Value | 0.24 | 0.0022 | 0.02 |
Depth | pH | EC (dS/m) | CEC (cmol (+)/kg) | Exch. Na | Exch. Ca | Exch. Mg | Exch. K | ESP | class |
|---|---|---|---|---|---|---|---|---|---|
Surface | 7.88c | 4.56a | 28.89ab | 4.23ab | 2.86ab | 3.78 | 1.56ab | 14.64 | saline |
0-30 | 7.97c | 5.11a | 28.86ab | 4.04ab | 3.92a | 6.84 | 1.87a | 13.99 | saline |
30-60 | 8.63bc | 3.62a | 33.62a | 6.35a | 3.58a | 6.79 | 1.50ab | 19.00 | sodic |
60-90 | 8.87ab | 3.42b | 22.19bc | 4.75ab | 2.42b | 7.73 | 1.34b | 18.63 | sodic |
90-120 | 9.75a | 3.25b | 15.88c | 3.25b | 2.34b | 7.94 | 1.22b | 15.77 | sodic |
Mean | 8.62 | 3.99 | 25.89 | 4.52 | 3.02 | 6.62 | 1.50 | 16.41 | sodic |
CV | 4.28 | 20.81 | 23.95 | 28.85 | 19.23 | 15.54 | 22.03 | 30.76 | |
LSD | 0.48 | 1.19 | 8.76 | 1.93 | 0.81 | ns | 0.45 | ns | |
P- Value | 0.01 | 0.01 | 0.07 | 0.03 | 0.002 | 0.30 | 0.04 | 0.78 |
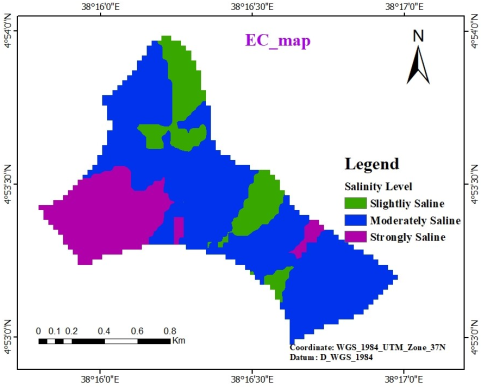
No | EC (ds/m) | Area (%) | Risk Level |
|---|---|---|---|
0 | 0-2 | 27.6 | Low |
1 | 2-4 | 51.0 | Medium |
2 | >4 | 21.4 | High |
Total | 100 | ||
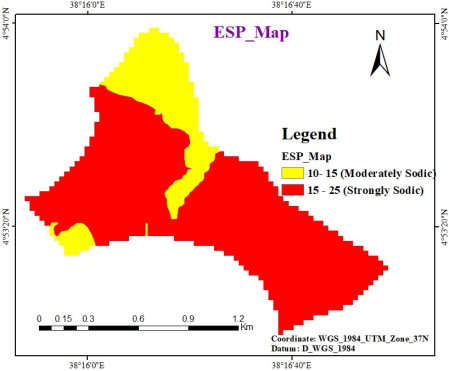
No | ESP (%) | Area (%) | Risk Level |
|---|---|---|---|
0 | 10-15 | 12.50 | Medium |
1 | 15-25 | 20.79 | High |
2 | >25 | 66.71 | Very High |
Total | 100.00 | ||
Description | pH | EC (ds/m) | Salinity class | SAR | Sodicity Hazards (FAO, 2008) |
|---|---|---|---|---|---|
Upper | 7.82 | 0.11 | Low saline | 5.0 | Low sodicity |
Middle | 7.74 | 0.21 | >> | 6.5 | >> |
Lower | 7.63 | 0.15 | >> | 4.8 | >> |
Mean | 7.73 | 0.16 | 5.43 |
Ca | Calcium |
CEC | Cation Exchange Capacity |
CV | Coefficient of Variation |
EC | Electrical Conductivity |
EDTA | Ethylene Diamine Tetra Acetic Acid |
ESP | Exchangeable Sodium Percentage |
FAO | Food and Agricultural Organization |
GIS | Geographic Information System |
K | Potassium |
LSD | Least Significant Difference |
Mg | Magnesium |
Na | Sodium |
pH | Potential of Hydrogen |
SAR | Sodium Adsorption Ratio |
US | United State |
| [1] | Tully, K., Sullivan, C., Weil, R., & Sanchez, P. The state of soil degradation in Sub-Saharan Africa: Baselines, trajectories, and solutions. Sustainability. 2015, 7(6), 6523-6552. |
| [2] | Zaman, M., Shahid, S. A., & Heng, L. Guideline for salinity assessment, mitigation and adaptation using nuclear and related techniques (p. 164). Springer Nature. 2018. |
| [3] | Chhabra, R. Soil salinity and water quality. Oxford & IBH publishing Co. Ltd, New Delhi, India. 2017. |
| [4] | Brady, N. C. and Weil, R. R. The Nature and Properties of Soils, Prentice Hall, New Jersey, NJ, USA, 13th edition. 2002. |
| [5] | Paul, D., & Lade, H. Plant-growth-promoting rhizobacteria to improve crop growth in saline soils: A review. Agronomy for Sustainable Development. 2014, 34(4), 737-752. |
| [6] | Awulachew SB, Yilma AD, Loulseged M, Loiskandl W, Ayana M, Alamirew T. Water Resources and Irrigation Development in Ethiopia. Working Paper 123. Colombo, Sri Lanka: International Water Management Institute. 2007; pp. 78. |
| [7] | Asfaw, S., Di Battista, F., & Lipper, L. Agricultural technology adoption under climate change in the Sahel: Micro-evidence from Niger. Journal of African Economies. 2016, 25(5), 637-669. |
| [8] | Sileshi, A. A., & Kibebew, K. “Status of Salt Affected Soils, Irrigation Water Quality and Land suitability of Dubti/Tendaho Area, North Eastern Ethiopia (Doctoral dissertation, Haramaya University). 2016. |
| [9] | Corwin, D. L.; Lesch, S. M. A simplified regional-scale electromagnetic induction - Salinity calibration model using ANOCOVA modeling techniques. Geoderma. 2014, 230, 288-295. |
| [10] | Jouyban, Z. The effects of salt stress on plant growth. Technical Journal of Engineering and Applied Sciences. 2012, 2(1), 7-10. |
| [11] | Abebe, T. F., Alamirew, T., & Abegaz, F. Appraisal and mapping of soil salinity problem in Amibara irrigation farms, Middle Awash basin, Ethiopia. International Journal of Innovation and Scientific Research. 2015, 13(1), 298-314. |
| [12] | Seid, M., & Genanew, T. Evaluation of soil and water salinity for irrigation in North-eastern Ethiopia: Case study of Fursa small scale irrigation system in Awash River Basin. African Journal of Environmental Science and Technology. 2013, 7(5), 167-174. |
| [13] | Zewdu, S., Suryabhagavan, K., & Balakrishnan, M. Geo-spatial approach for soil salinity mapping in Sego Irrigation Farm, South Ethiopia. Journal of the Saudi Society of Agricultural Sciences. 2017, 16(1), 16-24. |
| [14] | Coppock, D. L., The Borana Plateau of Southern Ethiopia: Synthesis of Pastoral Research, Development and Changes in 1980-1990. International Livestock Centre for Africa, Addis Ababa. 1994, 5: 374. |
| [15] | NMA (National Metrological Service Agency). Monthly Rainfall with Maximum and Minimum Temperature Data. 2023. |
| [16] | FAO/IIASA/ISRIC/ISS-CAS/JRC (Food and Agriculture Organization of the United Nations/International Institute for Applied Systems Analysis World Soil Information/Institute of Soil Science - Chinese Academy of Sciences/Joint Research Centre of the European Commission). Harmonized world soil database. 2012. (version 1.2) (Issue 1). |
| [17] | Fenan, T. Bobe, B. and Samuel, F. Assessment of Soil Erosion Risk Using Rusle Model at Haro Bake Watershed of Yabello District, Borana Zone, Southern Ethiopia. 2022. |
| [18] | Desta, S., Tezera, S., Gebru, G. and Kristjanson, P. M. Summary of Baseline Household Survey Results: Borana, Ethiopia. Research Program on Climate Change, Agriculture and Food Security (CCAFS). 2011. |
| [19] | Wogi, L., Dechassa, N., Haileselassie, B., Mekuria, F., Abebe, A., & Tamene, L. DA guide to standardized methods of analysis for soil, water, plant, and fertilizer resources for data documentation and sharing in Ethiopia. CIAT Publication. 2021. |
| [20] | Qadir, M., & Schubert, S. J. L. D. Degradation processes and nutrient constraints in sodic soils. Land degradation & development. 2002, 13(4), 275-294. |
| [21] | Jackson, M. L. Soil Chemical Analysis. Prentice Hall of India Pvt. Ltd., New Delhi, 1973: 498. |
| [22] | Zhang, M., Wang, H., Pang, X., Liu, H., & Wang, Q. Characteristics of soil salinity in the typical area of Yellow River Delta and its control measures. In IOP Conference Series: Earth and Environmental Science. 2017, 64(1), 012078). IOP Publishing. |
| [23] | Regional Salinity Laboratory (US). Diagnosis and improvement of saline and alkali soils. No. 60. US Department of Agriculture, 1954. |
| [24] | Li, J., & Heap, A. D. A review of comparative studies of spatial interpolation methods in environmental sciences: Performance and impact factors. Ecological Informatics. 2011, 6(3-4), 228-241. |
| [25] | Megersa, B., Markemann, A., Angassa, A., Ogutu, J. O., Piepho, H. P., & Zaráte, A. V. Impacts of climate change and variability on cattle production in southern Ethiopia: Perceptions and empirical evidence. Agricultural systems. 2014, 130, 23-34. |
| [26] | Jones JB. Agronomic handbook: management of crops, soils, and their fertility. CRC Press LLC, Boca Raton, Florida, USA, 2003, 482p. |
| [27] | FAO (Food and Agriculture Organization), Guide Line for Soil Description, FAO (Food and Agriculture Organization), Rome, Italy, 2006. |
| [28] | Tesfai, M., V. Dawod, K. Abresha. Drylands Coordination Group Report No. 20. Drylands Co-ordination Group. 2002. |
| [29] | W. Al-Jassem, A. Arslan, and F. Al-Sied. Common Weeds among Fodder Crops under Saline Conditions in Syria, Deir Ezzor Center, General Commission for Scientific Agricultural Research (GC SAR), Syria. 2008. |
| [30] | Kasahun, K. H, Zelalem., S., Ambase, A., and Mekonen, W. Characterization and Mapping of Soil Salinity Status at Small-Scale Irrigation Farm: The Case of Fantale Irrigation Project Sites. International Journal of Science, Technology and Society. 2024, 12(3), 108-119. |
| [31] | Hazelton, P., & Murphy, B. Interpreting soil test results: What do all the numbers mean? CSIRO publishing. 2016. |
| [32] | Bonanomi, G. “Repeated applications of organic amendments promote beneficial microbiota, improve soil fertility and increase crop yield,” Applied Soil Ecology, 2020; vol. 156, Article ID 103714. |
| [33] | Murphy, B. “Key soil functional properties affected by soil organic matter-evidence from published literature,” IOP Conference Series: Earth and Environmental Science. 2015, vol. 25, no. 1, Article ID 012008. |
| [34] | Mulat, A. Ashenaf, H. and Gezai, A. “Characterization and classifcation of salt afected soils and irrigation water in Tendaho sugarcane production farm, North-Eastern Rift Valley of Ethiopia,” African Journal of Agricultural Research. 2018, vol. 13, no. 9, pp. 403-411, Mar. |
| [35] | Singh, Kripal. "Microbial and enzyme activities of saline and sodic soils." Land Degradation & Development. 2016, 27(3), 706-718. |
| [36] | De la Paix, M. J., Lanhai, L., Xi, C., Varenyam, A., Nyongesah, M. J., & Habiyaremye, G. Physicochemical properties of saline soils and aeolian dust. Land Degradation & Development. 2013, 24(6), 539-547. |
| [37] | Sileshi, A., Kibebew, K., & Amanuel, Z. Temporal and spatial variations in of salt- affected soils using GIS and remote sensing at Dubti/Tendaho state farm. [Ph. D. Dissertation thesis]. Haramaya University, Ethiopia. 2015. |
| [38] | Aredehey, G., Libsekal, H., Brhane, M., Welde, K., & Giday, A. Top-soil salinity mapping using geostatistical approach in the agricultural landscape of Timuga irrigation scheme, South Tigray, Ethiopia. Cogent Food & Agriculture. 2018, 4(1), 1514959. |
| [39] | Zewdu, S., Suryabhagavan, K. V., & Balakrishnan, M. Land-use/land-cover dynamics in Sego Irrigation Farm, southern Ethiopia: A comparison of temporal soil salinization using geospatial tools. Journal of the Saudi Society of Agricultural Sciences. 2016, 15(1), 91-97. |
| [40] | Chekol, W., & Mnalku, A. Selected physical and chemical characteristics of soils of the middle awash irrigated farm lands, Ethiopia. Ethiopian Journal of Agricultural Sciences. 2012, 22(1), 127-142. |
| [41] | Biswas, A. Environmental Planning Management and Development; Tata McGraw-Hill Publishing Company, New Delhi. 1998; pp. 208-402. |
| [42] | FAO. Guidelines: Land Evaluation for Irrigated Agriculture. Soil Bulletin 55. Food and Agriculture Organization of the United Nations, Rome, Italy. 1985. |
| [43] | Westcott DW, and Ayers RS. Irrigation water quality criteria. In Irrigation with Reclaimed Municipal Wastewater: a Guidance Manual, Pettygrove GS, T. Asano T (eds). Lewis Publishers Inc., Chelsea, Mississippi. 1985. |
| [44] | Wallender, W. W. and Tanji, K. K. Agricultural Salinity Assessment and Man agreement. American Society of Civil Engineers (ASCE), Reston, 2011. |
APA Style
Tola, F., Lolo, I., Gurmu, F. (2025). Characterization, Classification and Mapping of Soil Salinity Status at Small Scale Irrigation Farm of Kedale, Yabello District, Borana Zone, Southern Ethiopia. International Journal of Natural Resource Ecology and Management, 10(2), 68-79. https://doi.org/10.11648/j.ijnrem.20251002.12
ACS Style
Tola, F.; Lolo, I.; Gurmu, F. Characterization, Classification and Mapping of Soil Salinity Status at Small Scale Irrigation Farm of Kedale, Yabello District, Borana Zone, Southern Ethiopia. Int. J. Nat. Resour. Ecol. Manag. 2025, 10(2), 68-79. doi: 10.11648/j.ijnrem.20251002.12
AMA Style
Tola F, Lolo I, Gurmu F. Characterization, Classification and Mapping of Soil Salinity Status at Small Scale Irrigation Farm of Kedale, Yabello District, Borana Zone, Southern Ethiopia. Int J Nat Resour Ecol Manag. 2025;10(2):68-79. doi: 10.11648/j.ijnrem.20251002.12
@article{10.11648/j.ijnrem.20251002.12,
  author = {Fenan Tola and Isihak Lolo and Feyissa Gurmu},
  title = {Characterization, Classification and Mapping of Soil Salinity Status at Small Scale Irrigation Farm of Kedale, Yabello District, Borana Zone, Southern Ethiopia
},
  journal = {International Journal of Natural Resource Ecology and Management},
  volume = {10},
  number = {2},
  pages = {68-79},
  doi = {10.11648/j.ijnrem.20251002.12},
  url = {https://doi.org/10.11648/j.ijnrem.20251002.12},
  eprint = {https://article.sciencepublishinggroup.com/pdf/10.11648.j.ijnrem.20251002.12},
  abstract = {Soil salinity is a significant challenge to crop productivity, particularly in arid and semi-arid regions. Effective mitigation requires a thorough understanding of soil chemical composition and water quality before implementing sustainable irrigation projects. This study aimed to characterize, classify, and map soil salinity and sodicity in the small-scale Kedale irrigation area of Yabello district. A total of 42 composite soil samples were collected from irrigated farm plots at four depths (0-30 cm, 30-60 cm, 60-90 cm, and 90-120 cm) and analyzed for soil texture, pH, electrical conductivity (EC), cation exchange capacity (CEC), exchangeable bases (Ca, Mg, Na, K), exchangeable sodium percentage (ESP), and sodium adsorption ratio (SAR). Soil salinity and sodicity were mapped using ArcGIS 10.8 with Kriging interpolation. Additionally, irrigation water samples were analyzed for ECe, pH, ESP, and SAR to assess water quality. The results showed that soil texture varied from sandy loam at shallow depths to sandy clay at deeper layers. The soil's average ESP, EC, and pH were 16.41%, 3.99 mmhos/cm, and 8.62, respectively, indicating that it is sodic according to FAO classification. Irrigation water analysis further revealed a slightly sodic nature. To ensure sustainable agricultural productivity in the Kedale irrigation scheme, immediate soil salinity management is recommended. Key interventions include gypsum application, organic amendments such as compost, the cultivation of salt-tolerant crops, the adoption of environmentally friendly irrigation practices, and farmer education on effective land and water management strategies.
},
 year = {2025}
}
TY  - JOUR
T1  - Characterization, Classification and Mapping of Soil Salinity Status at Small Scale Irrigation Farm of Kedale, Yabello District, Borana Zone, Southern Ethiopia

AU  - Fenan Tola
AU  - Isihak Lolo
AU  - Feyissa Gurmu
Y1  - 2025/04/28
PY  - 2025
N1  - https://doi.org/10.11648/j.ijnrem.20251002.12
DO  - 10.11648/j.ijnrem.20251002.12
T2  - International Journal of Natural Resource Ecology and Management
JF  - International Journal of Natural Resource Ecology and Management
JO  - International Journal of Natural Resource Ecology and Management
SP  - 68
EP  - 79
PB  - Science Publishing Group
SN  - 2575-3061
UR  - https://doi.org/10.11648/j.ijnrem.20251002.12
AB  - Soil salinity is a significant challenge to crop productivity, particularly in arid and semi-arid regions. Effective mitigation requires a thorough understanding of soil chemical composition and water quality before implementing sustainable irrigation projects. This study aimed to characterize, classify, and map soil salinity and sodicity in the small-scale Kedale irrigation area of Yabello district. A total of 42 composite soil samples were collected from irrigated farm plots at four depths (0-30 cm, 30-60 cm, 60-90 cm, and 90-120 cm) and analyzed for soil texture, pH, electrical conductivity (EC), cation exchange capacity (CEC), exchangeable bases (Ca, Mg, Na, K), exchangeable sodium percentage (ESP), and sodium adsorption ratio (SAR). Soil salinity and sodicity were mapped using ArcGIS 10.8 with Kriging interpolation. Additionally, irrigation water samples were analyzed for ECe, pH, ESP, and SAR to assess water quality. The results showed that soil texture varied from sandy loam at shallow depths to sandy clay at deeper layers. The soil's average ESP, EC, and pH were 16.41%, 3.99 mmhos/cm, and 8.62, respectively, indicating that it is sodic according to FAO classification. Irrigation water analysis further revealed a slightly sodic nature. To ensure sustainable agricultural productivity in the Kedale irrigation scheme, immediate soil salinity management is recommended. Key interventions include gypsum application, organic amendments such as compost, the cultivation of salt-tolerant crops, the adoption of environmentally friendly irrigation practices, and farmer education on effective land and water management strategies.

VL  - 10
IS  - 2
ER  -
Oromia Agricultural Research Institute, Yabello Pastoral and Dryland Agriculture Research Center, Yabello, Ethiopia